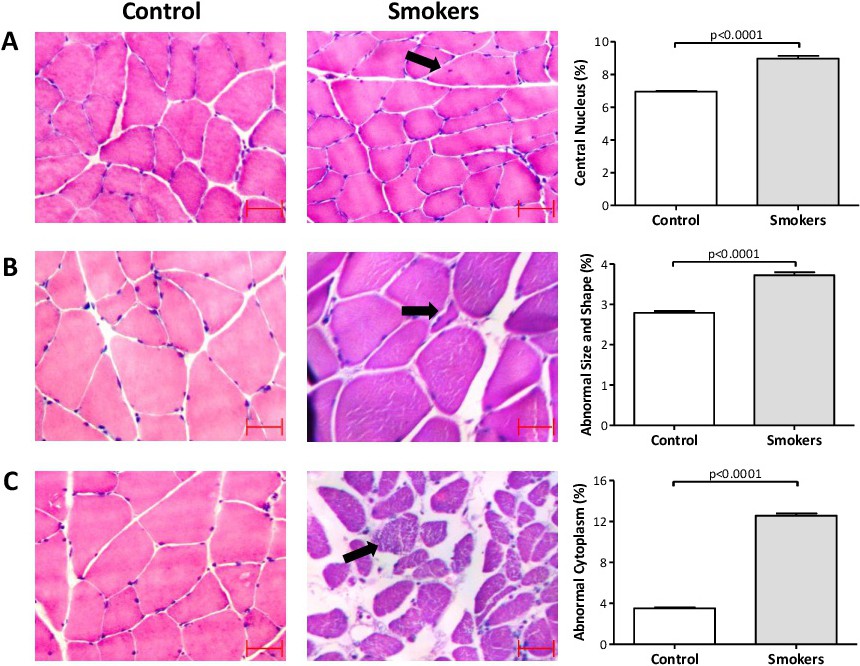
Fig. 1. Percentage of (A) central nucleus (black arrow); (B) abnormal size and shape (black arrow indicates a small fiber); and (C) abnormal cytoplasm (black arrow indicates the ruptured cytoplasm) in the studied groups. Representative photomicrographs for both groups in each analysis are shown (Scale bars = 50 µm). Data are mean ± SEM values.